BullionStar Financials FY 2020 – Year in Review
This post reviews BullionStar’s financial performance and milestones for the financial year ending 30 June 2020 (FY 2020).
At BullionStar, we have a tradition of sharing our financials transparently. We share key sales data, such as precious metals demand per product and product category along with other notable developments. Previous years financial reviews can be found below:
BullionStar Financials FY 2019 – Year in Review
BullionStar Financials FY 2018 – Year in Review
BullionStar Financials FY 2017 – Year in Review
BullionStar Financials FY 2016 – Year in Review
BullionStar Financials FY 2015 – Year in Review
FY 2020 was a record year for BullionStar with sales revenues totaling SGD 326.1M, a 137.7% increase from FY 2019. With the spot price of gold breaking north of the multi-year resistance level at USD 1370/oz and reaching USD 1790/oz by end June 2020, interest and demand from investors that had been on the sidelines for the past few years had been renewed. Silver followed in a volatile manner with the USD spot price of silver moving sharply up, down and up again throughout FY 2020.
We launched our services in New Zealand in August 2019. Our customers now have the option to buy, store, audit, take delivery or sell precious metals with New Zealand as their choice of location as another means of diversification. With New Zealand being a safe and politically stable country and geographically located away from the troubled hotspots of the world, it is our view that New Zealand is an attractive jurisdiction for international diversification of bullion storage. There are no taxes imposed on bullion in New Zealand.
In the second half of FY 2020, as countries across the world reacted to COVID-19, with many refineries across the world operating from a limited capacity, our strategy was to aggressively stock bullion during early 2020 at the first signs of shortages appearing. Such shortages of product from mints and refineries were particularly significant in March and April of 2020 where price discovery based on paper markets had experienced a drastic increase in spreads leading to high premiums and buy/sell spreads.
Gold Price and Silver Price during FY 2020
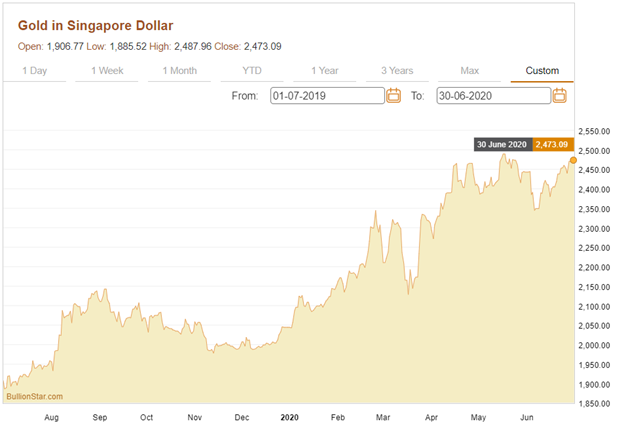
The spot gold price, denominated in Singapore dollars, increased from SGD 1907 on 1 July 2019 to SGD 2473 on 30 June 2020. This marks a 29.68% increase in the SGD spot gold price during FY 2020.

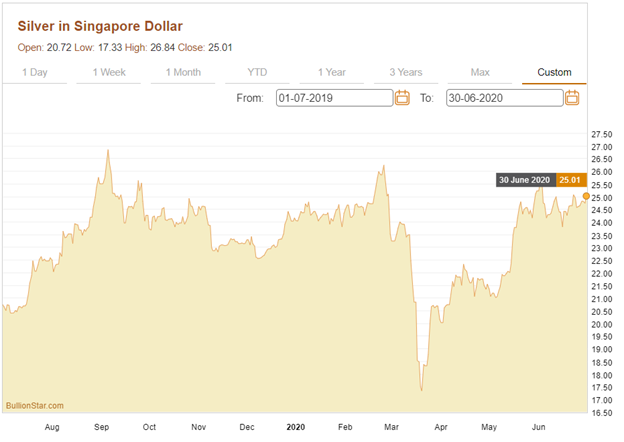
The spot silver price denominated in Singapore dollars, experienced higher volatility over the fiscal year. It traded to a high of SGD 26.84 in September 2019, before trading to a low of SGD 17.33 in March 2020 and trading back to SGD 25.01 on 30 June 2020. The silver price opened the fiscal year at SGD 20.72, and closed at SGD 25.01 on 30 June 2020, a 20.7% increase in the SGD silver spot price during FY 2020.

BullionStar Financials FY 2020 – Year in Review – Sales
During FY 2020, BullionStar’s sales revenue was SGD 326,144,441 which was a 137.7% increase from FY 2019.
Sales per Product Category
In FY 2020, gold represented 73.56% of sales (FY 2019: 77%) and silver represented 23.88% (FY 2019: 20.9%). The breakdown of sales between gold and silver saw a marginal shift towards silver compared to FY 2019. Within the gold category, 86.24% of total revenues were for gold bars, 13.38% for gold coins, and the remaining for numismatics and gold jewellery.
Together, 100 gram gold bars and 1 kg gold bars continued to represent most of the gold bar sales, and in the gold coin category the most popular gold coins were Canadian Gold Maple Leaf coins followed by Australian Gold Kangaroo coins.

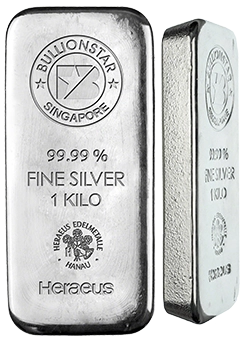
Silver bars accounted for 19.9% of BullionStar’s total revenue, with the 1 kg silver bars being the most popular, followed by the LBMA Good Delivery silver bars. In the silver coin category, the Canadian Silver Maple coins were the most popular silver coin in FY 2020. The interest for platinum coins and bars increased during the year albeit from low levels. Platinum sales amounted to 2.4% of total sales (FY 2019: 1.9%).
FY 2020 saw BullionStar expand customer activity with a total of 25,105 customer buy orders during the year, a 39.3% rise compared to FY 2019. The average order size in FY 2020 was SGD 12,991 up from SGD 7,622 the year before. Median order size in FY 2020 had increased significantly compared to FY 2019 at SGD 1,683.28, up from SGD 716.

BullionStar continues to be popular around the globe, with customers from 102 countries represented in FY 2020 sales. Since we launched in 2012, there have now been customers from 119 countries worldwide. The BullionStar.com website was busier year-on-year in FY 2020, registering 3,103,323 visits, up 73.6% on the previous year’s 1,786,907 visits.
BullionStar Vault Storage
At the end of FY 2020, BullionStar stored approximately SGD 343.2 million (FY 2019: 185.4 million) in precious metals on behalf of customers as vault storage provider. This represents a 85.1% increase in value stored compared to the end of FY 2019.
Increase in Shipping Orders
The number of shipments processed increased 695% in FY 2020. Most of the increase in shipments occurred domestically within Singapore. For international shipments, we have chosen to absorb and thereby reduce shipping costs to clients globally to make it more attractive for international customers to purchase and ship bullion to their respective countries.
Take a Tour
Given the travel restrictions imposed by many nations across the world, we have created a virtual tour of our bullion center so that you can walk through and discover the features you would have been able to experience if you were here in person! Our star exhibit showcasing a 400 oz Gold Bar has a dedicated page for you to explore. Click the image below to find out more!
Popular Blog Posts by BullionStar
 How Much Gold is in the FIFA World Cup Trophy?
 Essentials of China's Gold Market
 Singapore Rated the World’s Safest & Most Secure Nation
 Infographic: Gold Exchange-Traded Fund (ETF) Mechanics
 BullionStar Financials FY 2020 – Year in Review
 Silver’s Coming Breakout: Expert Insights from Peter Krauth
 The Golden Truth: How Financial Advisors’ Silence on Bullion Could Cost You Your Wealth
 US Announces New Tariffs: What It Means for Your Wealth and Why Gold Still Wins
 The U.S. Dollar’s Decline: Why Precious Metals Matter More Than Ever
 Secure Gold Storage in Singapore: Inside BullionStar’s Premier Vault Facility


 BullionStar
 0 Comments


